TSearch Dashboard Widget Tutorial
The Simflofy View Template is the base template for Simflofy and allows you to easily search and view your indexed content. You can also visualize your data using the Simple TSearch Dashboard widget. This can be set up by replacing the Result Set Widget in the body of the view.
Body Widgets
Most Content Widgets (the ones in the Body section), will not function with the dashboard widget. It is suggested you copy the view if you wish to experiment with it.
With this Dashboard you will be able to visualize data from your documents using the Chart Widget, and have the charts dynamically update as you drill down.
Dashboard Example
In this example we will be visualizing the Repositories and the Content types of the documents within. You can add visualizations by setting up a Chart Facet Widget and adding it to your Simple Dashboard Content View. In this widget you can choose your chart type and which field you would like to visualize.
As you add filters you can see them at the top in red. If you have added a filter you no longer want, click the trash can button next to it to remove it from the search criteria. To start over click the Clear All Filters button. Once you have your dashboard set the way you want you can save your search using the Saved Searches Widget to run again in the future without having to reselect your filters.
Useful Sidebar Widget for the Dashboard
Following are some widgets you can use to filter your data and customize how your TSearch Dashboard can be displayed.
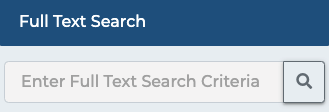
Use the Full text search to visualize how many documents in which repositories contain the entered keyword. Type in the word you are looking for within the file name and press enter or click the magnifying glass to begin search.
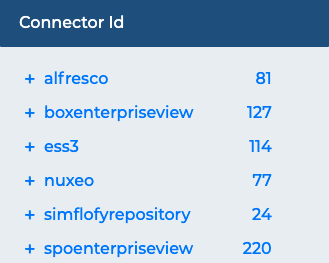
Use the Facet Select Widget in tandem with adding a Facet Field in your Search Connection Configuration to get a count of how many times a value appears for a specific field. Some preloaded examples break down indexed documents by their connector id (which represents their source repository) or their content type. Clicking on one of the items, will drill down to only documents whose field match the selected value.
For example, clicking nuxeo will refresh the dashboard to only show information about documents indexed in Nuxeo
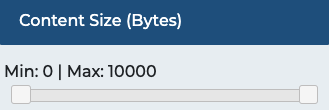
You can also use the content size slider widget to visualize only files of a certain size range. For example if you wanted to see how many files are larger than 5kb you would slide the slider to 5000 and see which repositories and how many files meet these criteria.
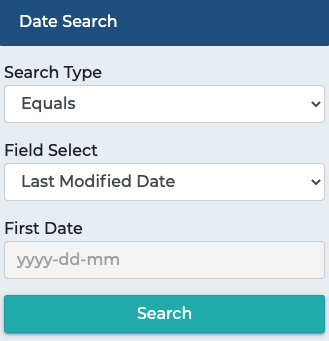
Using the Date Select Widget we can visualize the count of files that have been either created by or modified on, before, or after a certain date. You can also select a range of dates to search on.
You can configure this widget to report on any date field and for the following search types:
- Equals
- Before
- After
- Range