TSearch Reports
Simflofy's TSearch platforms allows users to view reports of the data in their repositories. You can conduct a variety of actions on the files including some Record Management actions. You can also visualize your data in a customizable dashboard and see how many of your files contain sensitive Personable Identifiable Information (PII). This section will show you examples of the reports you will be able to customize to view analyze and manage your data all in one place.
To build any of the following reports, create a content view with the widgets listed in the Left Sidebar, Body and Top Menu tabs.
Basic Search View Report
- Overview
- Left Sidebar
- Body
- Top Menu
Allow you to view all the documents in your repository. You can filter your view by keyword search, content type, file size, date created or modified and location. More filters can be added through facet search widgets.
You can also take document actions such as view metadata, download file, edit file properties and other actions based on file type.
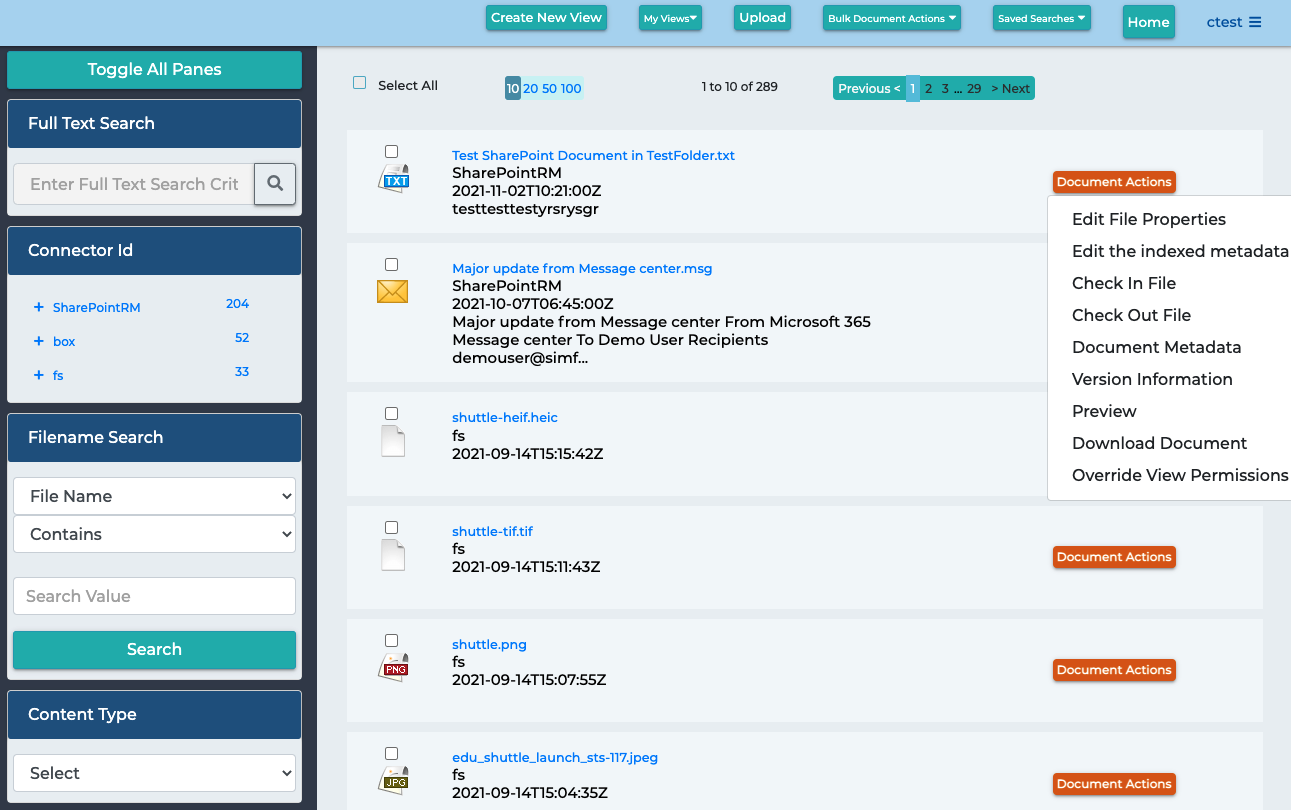
The following widgets can be added to the left sidebar and are used to filter your search results. In this basic search view example you can perform the following filters. Click on the widget name links for more information including configuration detail.
- Default Current Search: Displays all of the indexed files
- Full Text: Searches for text inside the files
- Connector ID: Allows you to only show files in the selected connector
- Filename Search: Search for files by filename
- Content Type Dropdown: Filter results by content type
- More Like This: Displays more search results like the file selected
The following widgets control the body of the search view page. It determines how the results are displayed and what actions you can take on any selected files. Click on the widget name links for more information including configuration detail.
- Default Pagination: Controls the page navigation
- Default Result Set: Displays all searched files
- Edit File Properties: Allows users to edit certain parts of a file's properties
- Check In: Allows users to check in a file
- Checkout: Allows users to check out a file
- LightBox Image Viewer: Preview an image
- Metadata Display: Display the metadata for a file
- Version Info: See a file's versioning information and download selected versions
- Arender Preview: Preview a file
- Content Download: Download a file
The following widgets will add buttons to the top menu that can perform actions for the platform, the content, and the content view. Click on the widget name links for more information including configuration detail.
- Save and Retrieve Searches: Save your search filters and rerun them at a later date
- Bulk Download: Download multiple files
- Drag and Drop: Upload multiple files
- My Views: A dropdown list of all the content views you have access to
- New View: Create a new report based on the current view
- Metadata Export: Export the file properties for multiple files
Search View with Records Management Report
- Overview
- Left Sidebar
- Body
- Top Menu
This search view will add Records Management functionalities to the basic search view described above. Users can apply holds, mark files as records, add them to retention schedules, apply security marks and filter searches by these values. You can also view record events and file properties.
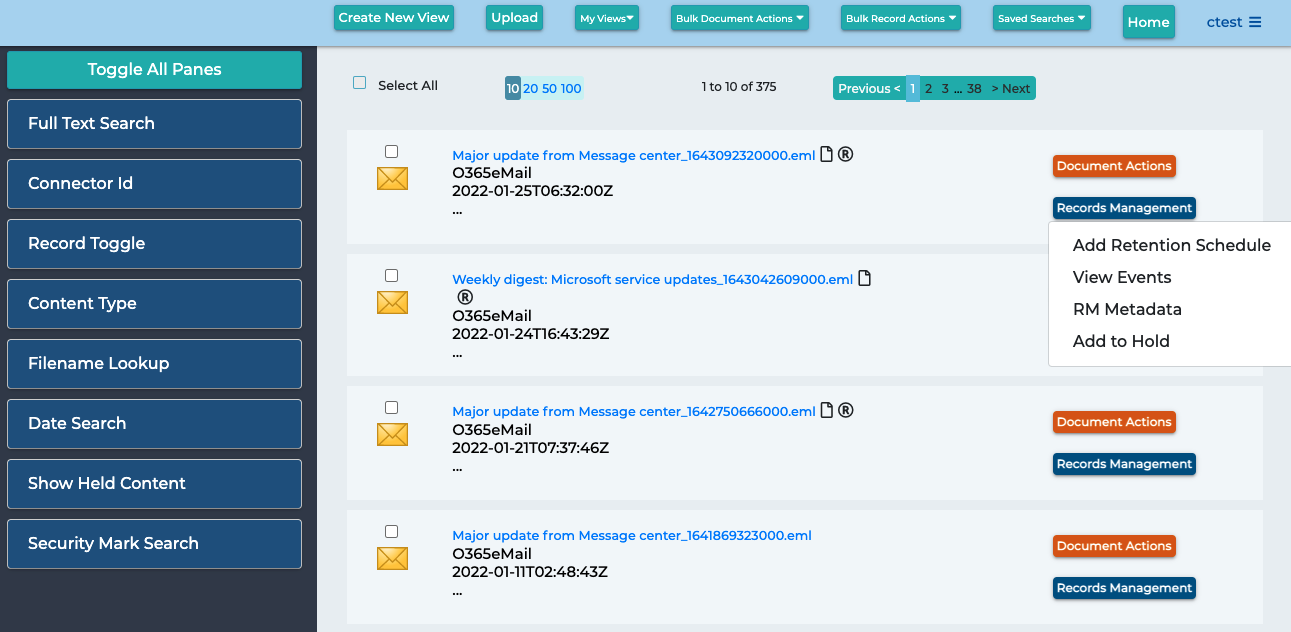
The following widgets can be added to the left sidebar and are used to filter your search results. In this search view example you can perform the following filters. Click on the widget name links for more information including configuration detail.
- Full Text: Search through the content of the files for keywords
- Connector ID: filter for files in a particular connector
- Record Toggle: Check to filter results for files marked as records
- Content Type Dropdown: Filter results by content type
- Filename Facet Select: Search for keywords in file names
- Basic Date Select: Filter for content by date created or date modified
- Default Current Search: Shows filters at the top of the page
- Toggle Holds: Filter for records that are on hold
- Security Mark Search: Filter for record security marks
The following widgets control the body of the search view page. It determines how the results are displayed and what actions you can take on any selected file. Click on the widget name links for more information including configuration detail.
- Default Result Set: Is the default search view of all files
- Default Pagination: Controls the page navigation
- Content Download: Allows users to download the file
- RM Results: Adds records management functions including an RM action button for each file
- RM Metadata: Lets you download the record management metadata
- RM Events: If there are any events on the record you can view them with this widget
- Arender Preview: Allows you to preview the file's content
- Check In: Checks in a record
- Checkout: Checks out a record
- Version Info: Provides versioning information
- Metadata Display: displays the metadata for the file
- Edit File Properties: Allows users to edit certain parts of a file's metadata
- Document Holds: Puts a hold on a document preventing any changes or deletions
- Add To View: Add a file to another content view
- Remove Documents: Allows users to remove documents from a view
The following widgets will add buttons to the top menu that can perform actions for the platform, the content, and the content view. Click on the widget name links for more information including configuration detail.
- Save and Retrieve Searches: Save your search filters and rerun them at a later date
- Metadata Export: Export your files properties
- Bulk Records: Perform record management actions on multiple files
- My Views: A dropdown list of all the content views you have access to
- Bulk Download: Download multiple files
- Drag and Drop: Upload multiple files by dragging and dropping them
- New View: Create a new content view
Dashboard Views
- Overview
- Left Sidebar
- Body
- Top Menu
Will allow the user to visualize their data through the use of chart widgets. The visualizations will change in real time as you add filters such as location and file sizes.
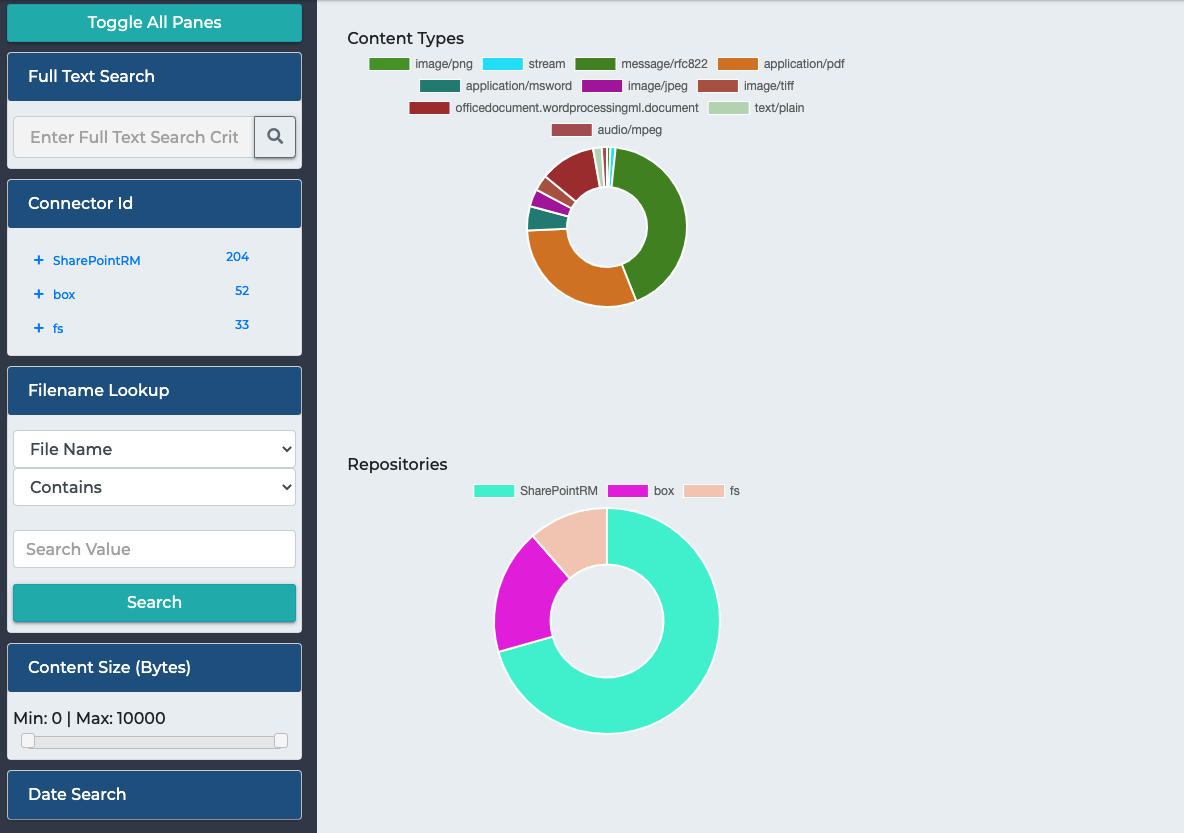
The following widgets can be added to the left sidebar and are used to filter your charted results. In this dashboard view example you can perform the following filters. Click on the widget name links for more information including configuration detail.
- Default Current Search: Shows filters at the top of the page
- Full Text Search: Search through the content of the files for keywords
- Connector ID: Filter for files in a particular connector
- Filename Facet Select: Search for keywords in file names
- Content Slider: Filter by file size
- Basic Date Select: Filter by file date created or modified
The following widgets control the body of the search view page. It determines how the results are displayed and what actions you can take on any selected file. Click on the widget name links for more information including configuration detail.
- Simple Dashboard: Dashboard layout
- Content Types Chart: Chart of file count by file content type
- Repository Chart: Chart of file count by connector id
The following widgets will add buttons to the top menu that can perform actions for the platform, the content, and the content view. Click on the widget name links for more information including configuration detail.
- Save and Retrieve Searches: Save current search filters and rerun at a later date
- My Views: Dropdown list of content views
- New View: Create a new view based on the current view and filters
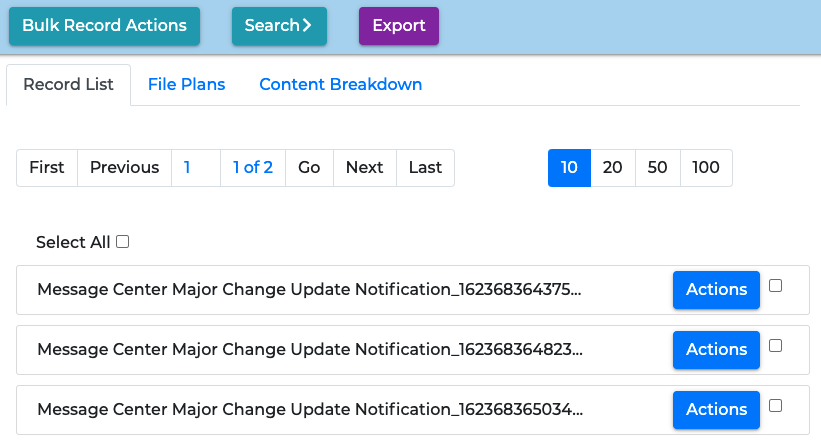
Records Management View
Will allow you to conduct a variety of actions to manage your files. You can set retention plans, add holds, audit records and more. Click here for more details on the Records Management Views
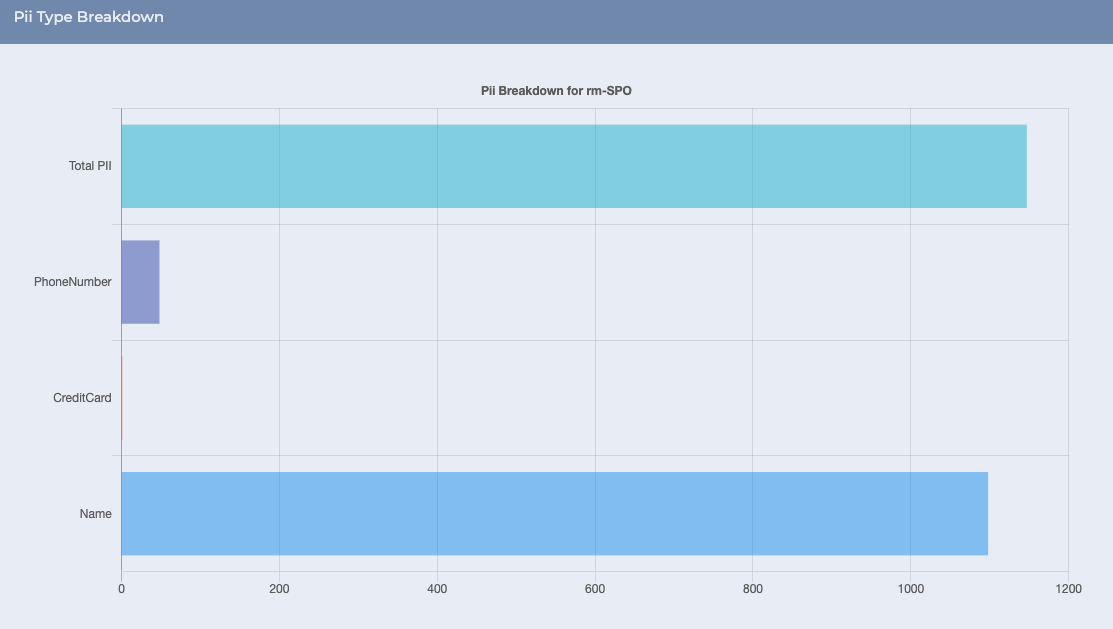
PII Analysis Report
Will tell you how many of your files contain personal information such as names, phone numbers and credit card numbers. Click here for more detail on how to set up this view as a chart and as well as a search view, so you can take action on these files.
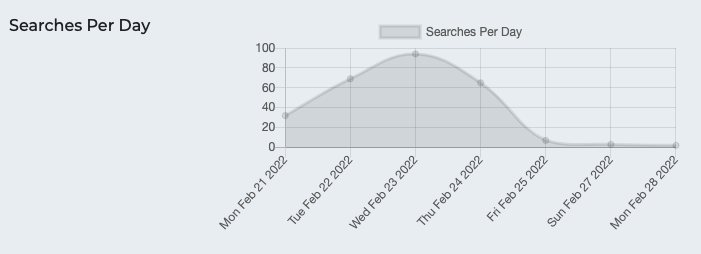
Connector Report Dashboard
The Connector Report is a report of the selected connectors. It shows a usage report for the configured search connection and includes the most commonly used terms and searches per day.
This report uses the Connector Report Widget and doesn't interact with any other widgets added to the left sidebar or body sections.
File Age Analysis Report
Allows you to visualize and analyze the age of your files by using the date search to get a list of files that haven't been touched in a while and determine if you want to archive transfer or delete these old files.
You can build this report by adding a Date Select Widget to your search content view. Use the modified date as your target field.
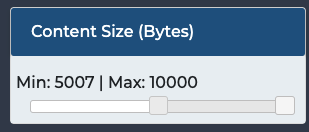
File Size Analysis Report
Will tell you which of your files are taking up the most space in your repositories. You can use the file size slider widget to search for files of a certain size in Bytes. This can be viewed in either a chart for visualization, or in a search view to take actions on the found files.
To build a report based on file size, add the Slider Widget to the left menu section of your content view. Set the target field as simflofy_length.
Related Articles
Configuring TSearch Content Views
Federated Search Configurations