Kibana Dashboards
A dashboard is a collection of visualizations, searches, and maps, typically in real-time. Dashboards provide at-a-glance insights into your data and enable you to drill down into details.
WithDashboard, you can:
- Add visualizations, saved searches, and maps for side-by-side analysis
- Arrange dashboard elements to display exactly how you want
- Customize time ranges to display only the data you want
- Inspect and edit dashboard elements to find out exactly what kind of data is displayed
The following are the steps you take to create and organize your dashboard
Create a dashboard
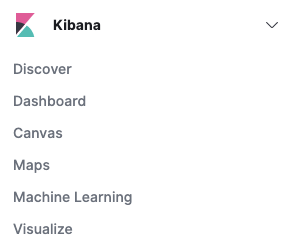
To create a dashboard, you must have data indexed into Elasticsearch, an index pattern to retrieve the data from Elasticsearch, and visualizations, saved searches, or maps. To begin, open the menu, go toDashboard, then clickCreate dashboard.
Add elements
The visualizations, saved searches, and maps are stored as elements in panels that you can move and resize. You can add elements from multiple indices, and the same element can appear in multiple dashboards.
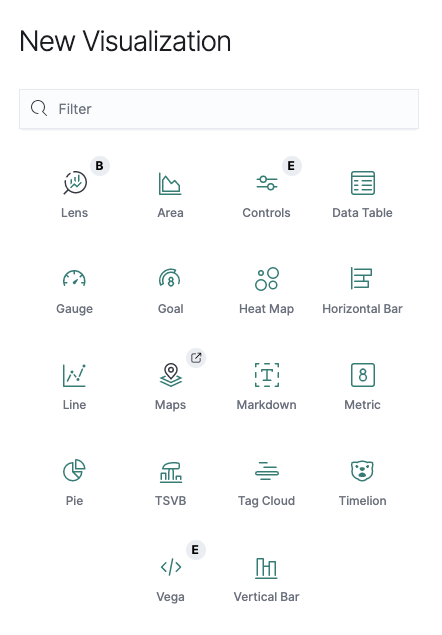
- To create an element: Click Create new. On the New Visualization window, click the visualization type.
- To add an existing element: Click Add. On the Add panels flyout, select the panel. When a dashboard element has a stored query, both queries are applied.
Arrange dashboard elements
In Edit mode, you can move, resize, customize, and delete panels to suit your needs.
- To move a panel, click and hold the panel header and drag to the new location.
- To resize a panel, click the resize control and drag to the new dimensions.
- To toggle the use of margins and panel titles, use the Options menu.
- To delete a panel, open the panel menu and select Delete from dashboard. Deleting a panel from a dashboard does not delete the saved visualization or search.
Use drill-downs for dashboard actions
Drill-downs, also known as custom actions, allow you to configure a workflow for analyzing and troubleshooting your data. Using a drill-down, you can navigate from one dashboard to another, taking the current time range, filters, and other parameters with you, so the context remains the same. You can continue your analysis from a new perspective.
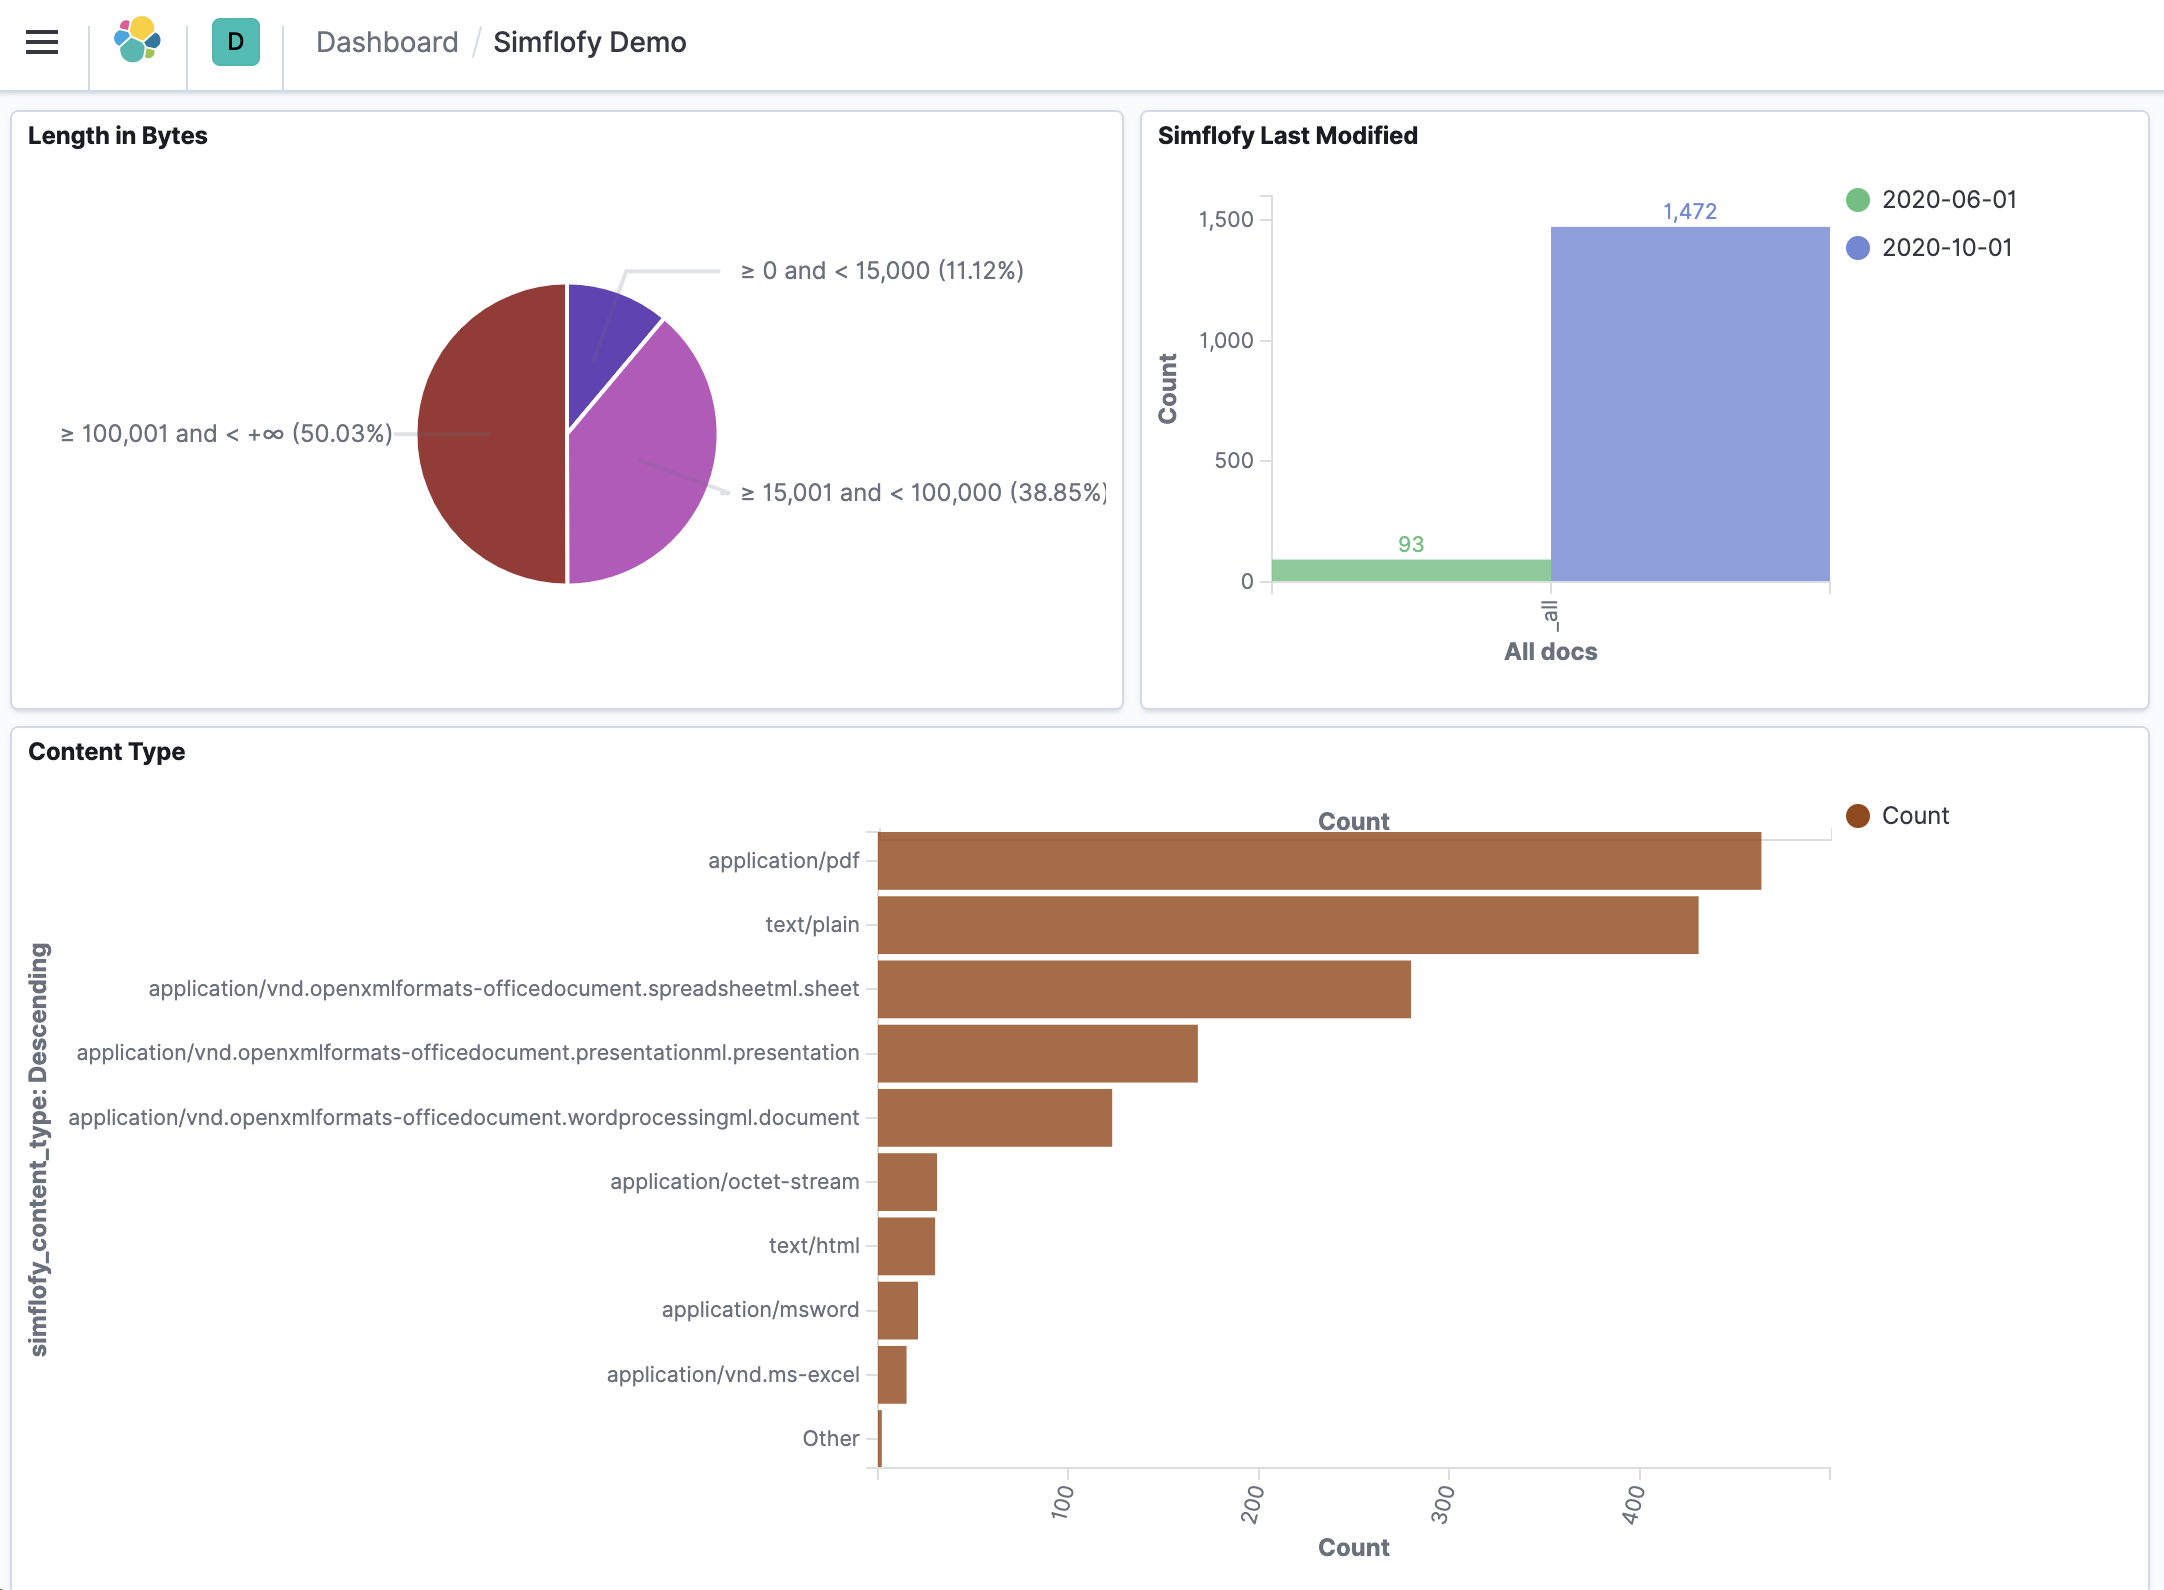
Sample Dashboard