Get Started With Kibana
Kibana is a free and open user interface that lets you visualize your Elasticsearch data and navigate the Elastic Stack. You can chart and report on the properties of your files such as document age, modified dates, group data by document types and other variable to help you see exactly what your content consists of. Following are the steps needed to get started reporting in Elasticsearch Kibana.
Elasticsearch Installation
In order to use Kibana you must have Elasticsearch installed on your server and have it connected to Simflofy where it has been integrated with your other repositories. In this example we will be using the file folder (file system) for the Repository where the files are stored.
Use the following link for detailed instructions on how to install Elasticsearch on your server:
Elasticsearch Installation Instructions

Simflofy Integration
Create a Simflofy Integration from your source location to your newly installed Elasticsearch Server location by setting up the following Elasticsearch connections in Simflofy.

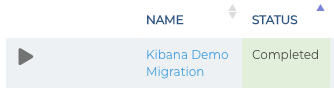
Once the Simflofy connections are set up you will be able to configure and run the integration to begin transferring your data.
- Migration Setup
Click here for more detail on set up and configuration

Kibana Discovery
Discover enables you to explore your data, find hidden insights and relationships, and get answers to your questions.
With Discover, you can:
- Access every document in every index that matches your selected index pattern
- Search your data and filter the search results
- Get field-level details about the documents that match your search
- View the events that occurred just before and after a document
To use Kibana Discover:
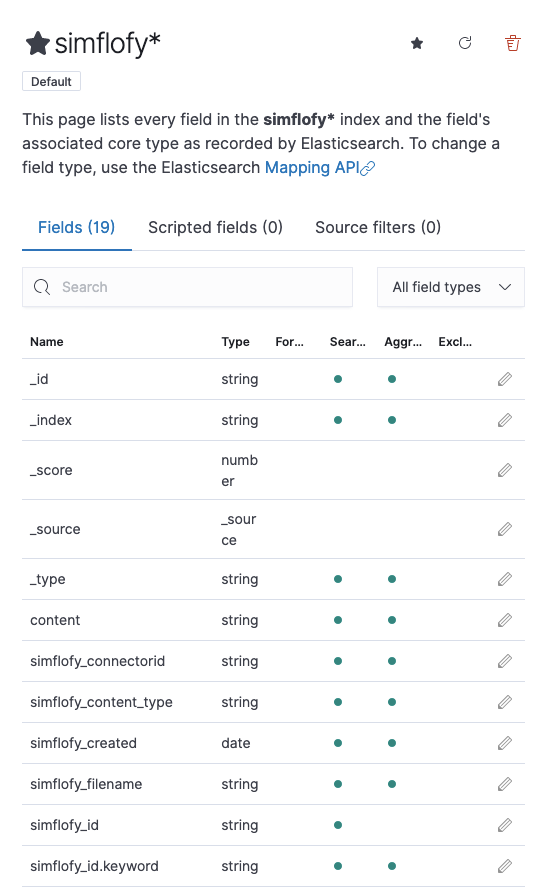
- First clicking on the Connect to your Elasticsearch Index Link and create an index pattern from your Elasticsearch Simflofy connected index
- Next click Discovery in the navigation pane. This will give you the properties of the contents in your repository. Name, last modified, created date, content type ect...
- Now that you can see the contents of your data you can start creating queries and filters for visualization
Click here for more detail on Kibana Discovery
Visualizations
Visualize enables you to create visualizations of the data from your Elasticsearch indices, which you can then add to dashboards for analysis.
Kibana visualizations are based on Elasticsearch queries.
By using a series of Elasticsearch aggregations to extract and process your data, you can create charts that show you the trends, spikes, and dips you need to know about.
To create a visualization:
- Select Visualize from the navigation menu.
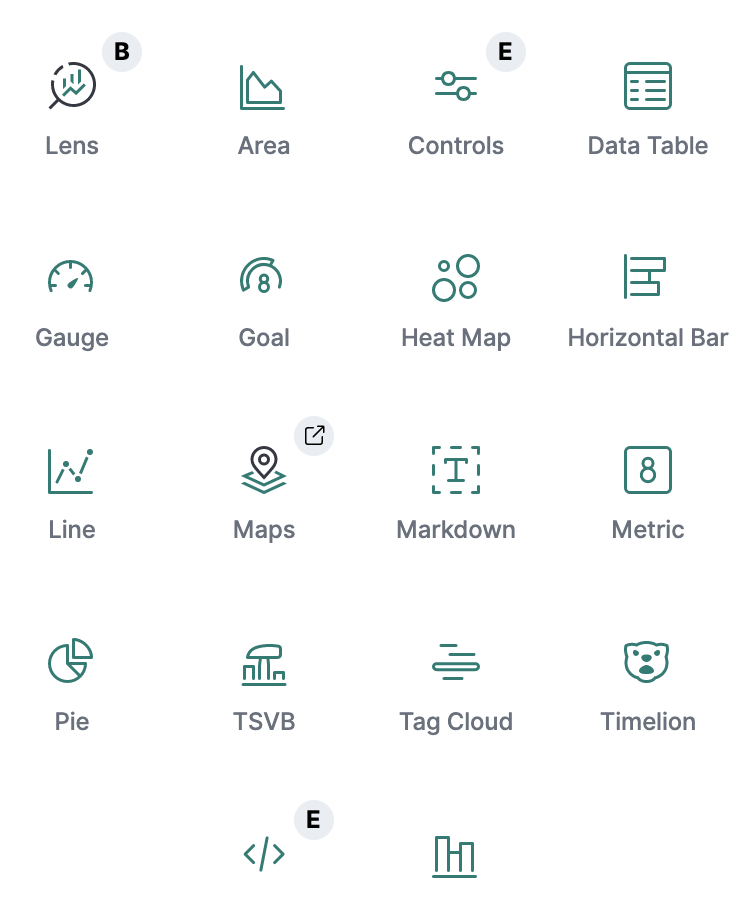
- Click the Create Visualization button
- Select your chart type
- Chose your fields
- Add any parameters
Click here for more detailed instructions on Kibana visualizations.
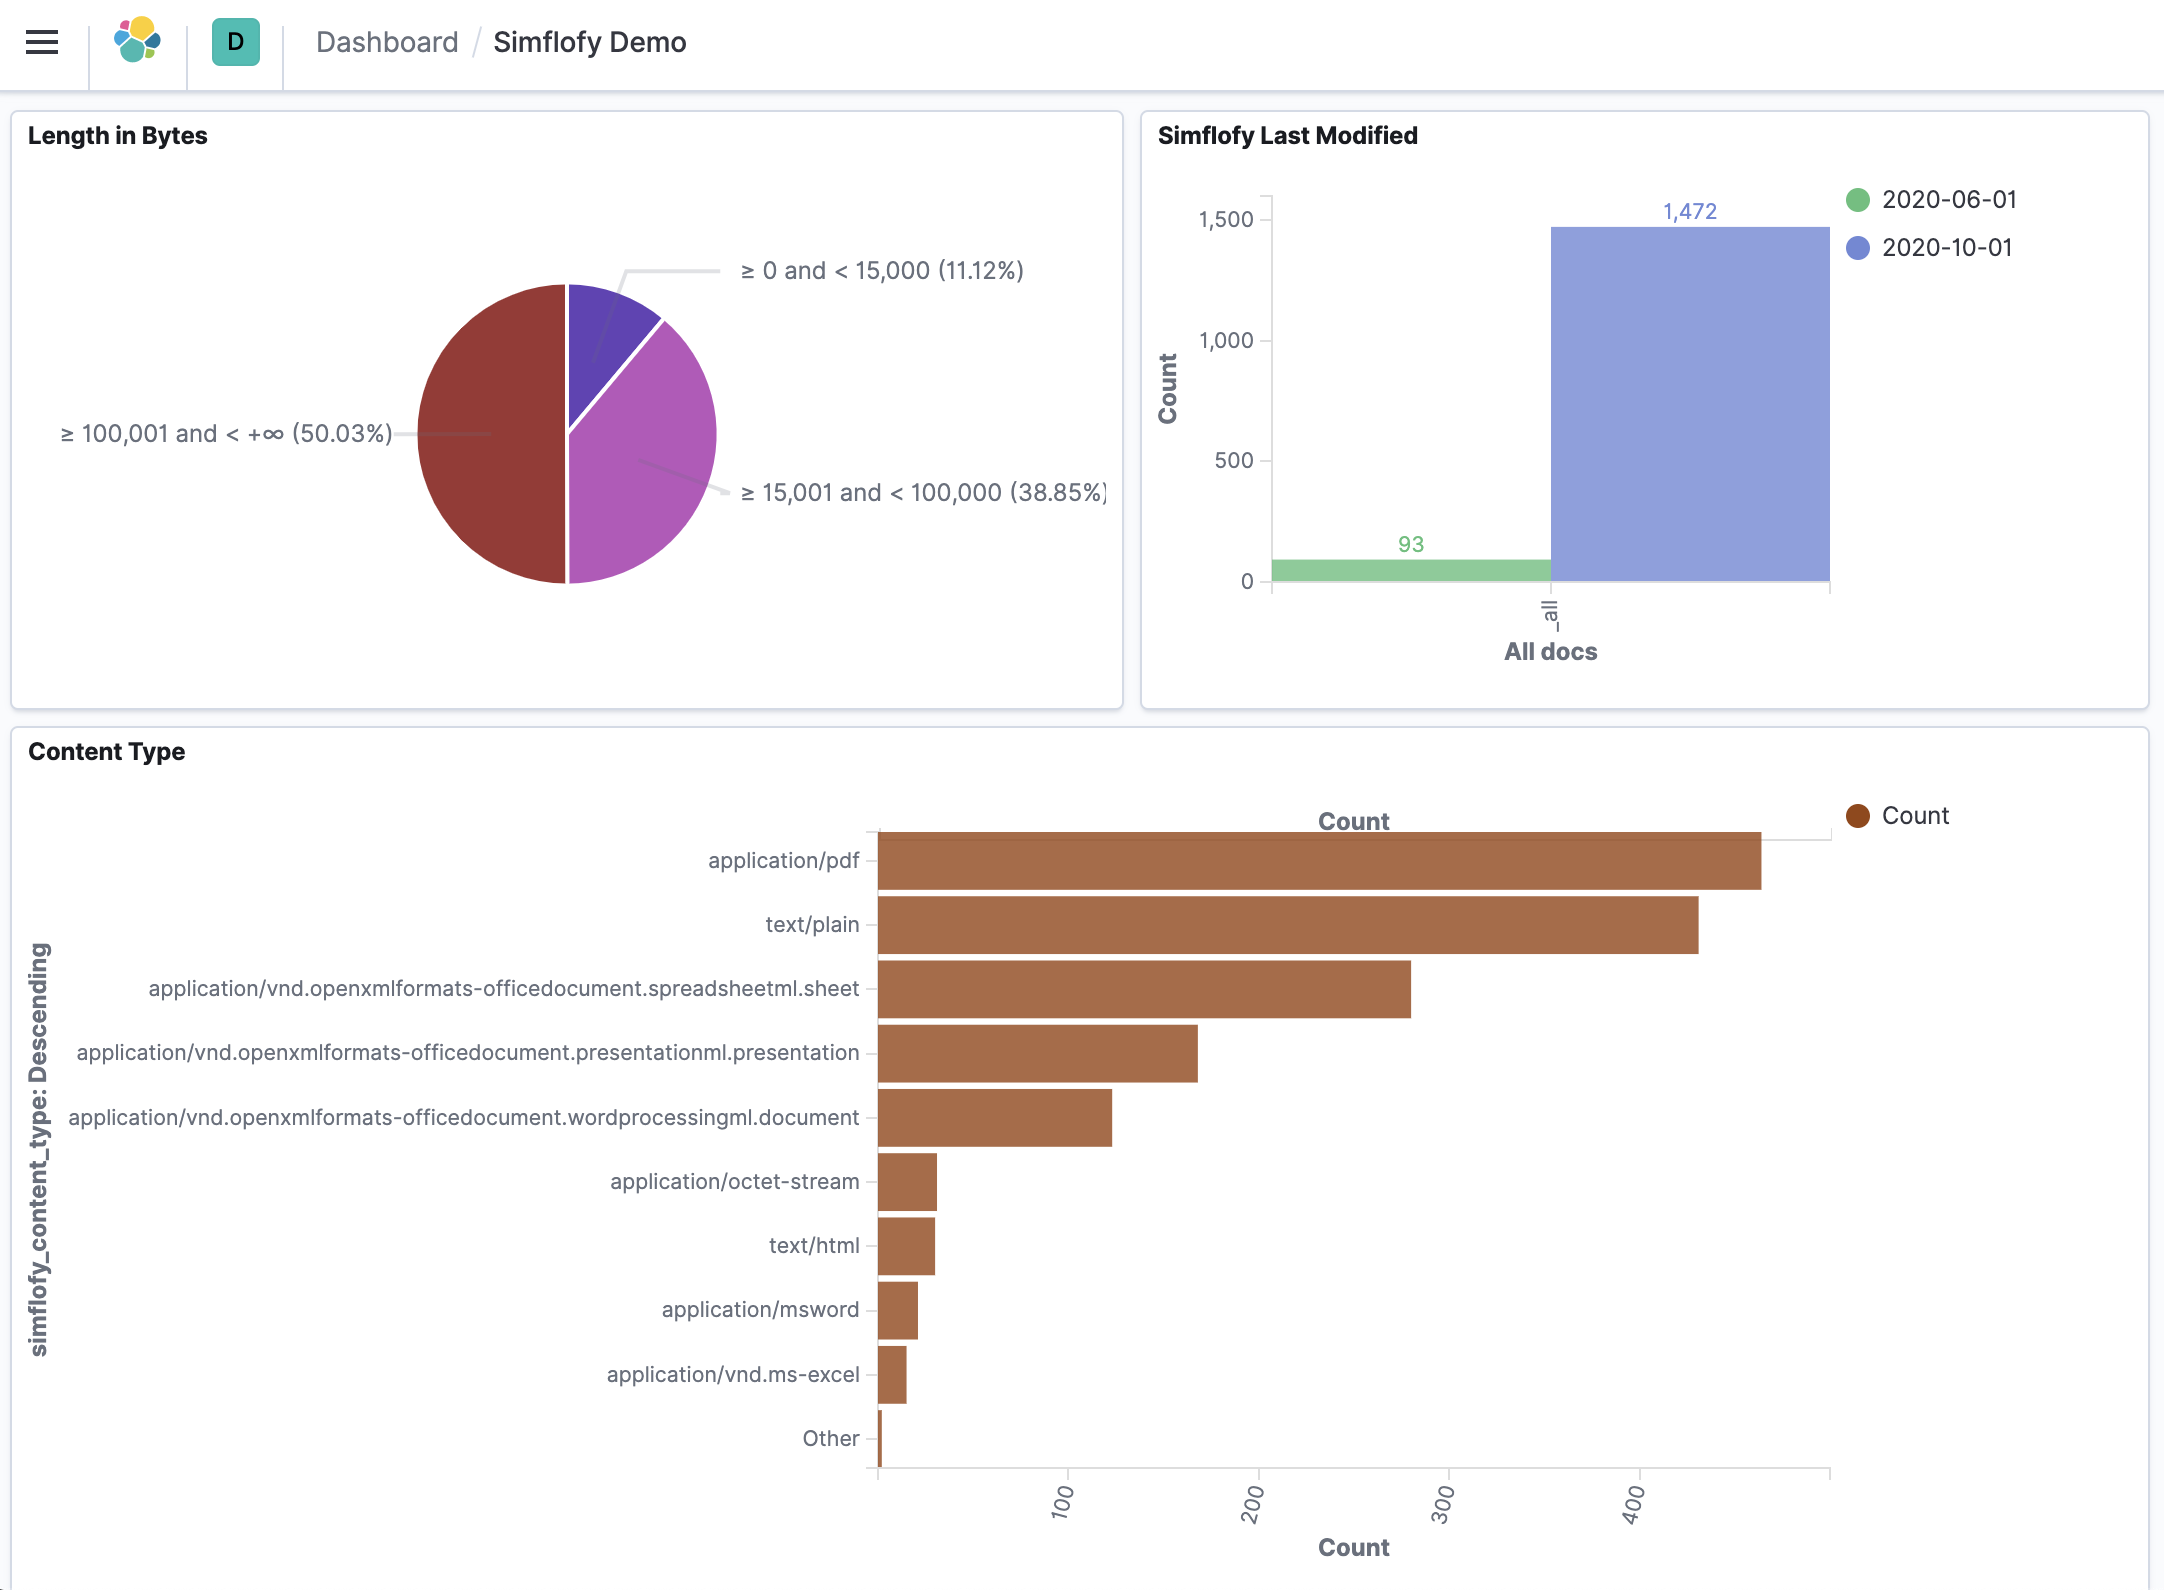
Dashboards
The Kibana Dashboard is a collection of visualizations, searches, and maps, typically in real-time. Dashboards provide at-a-glance insights into your data and enable you to drill down into details.
WithDashboard, you can:
- Add visualizations, saved searches, and maps for side-by-side analysis
- Arrange dashboard elements to display exactly how you want
- Customize time ranges to display only the data you want
- Inspect and edit dashboard elements to find out exactly what kind of data is displayed
Click here for more detailed instructions on creating Dashboards in Kibana.